Coming Soon · v1.2.0
ServerWatch
Native server monitoring for macOS and iOS: load, trends and incidents at a glance.
macOS 14+ & iOS 17+
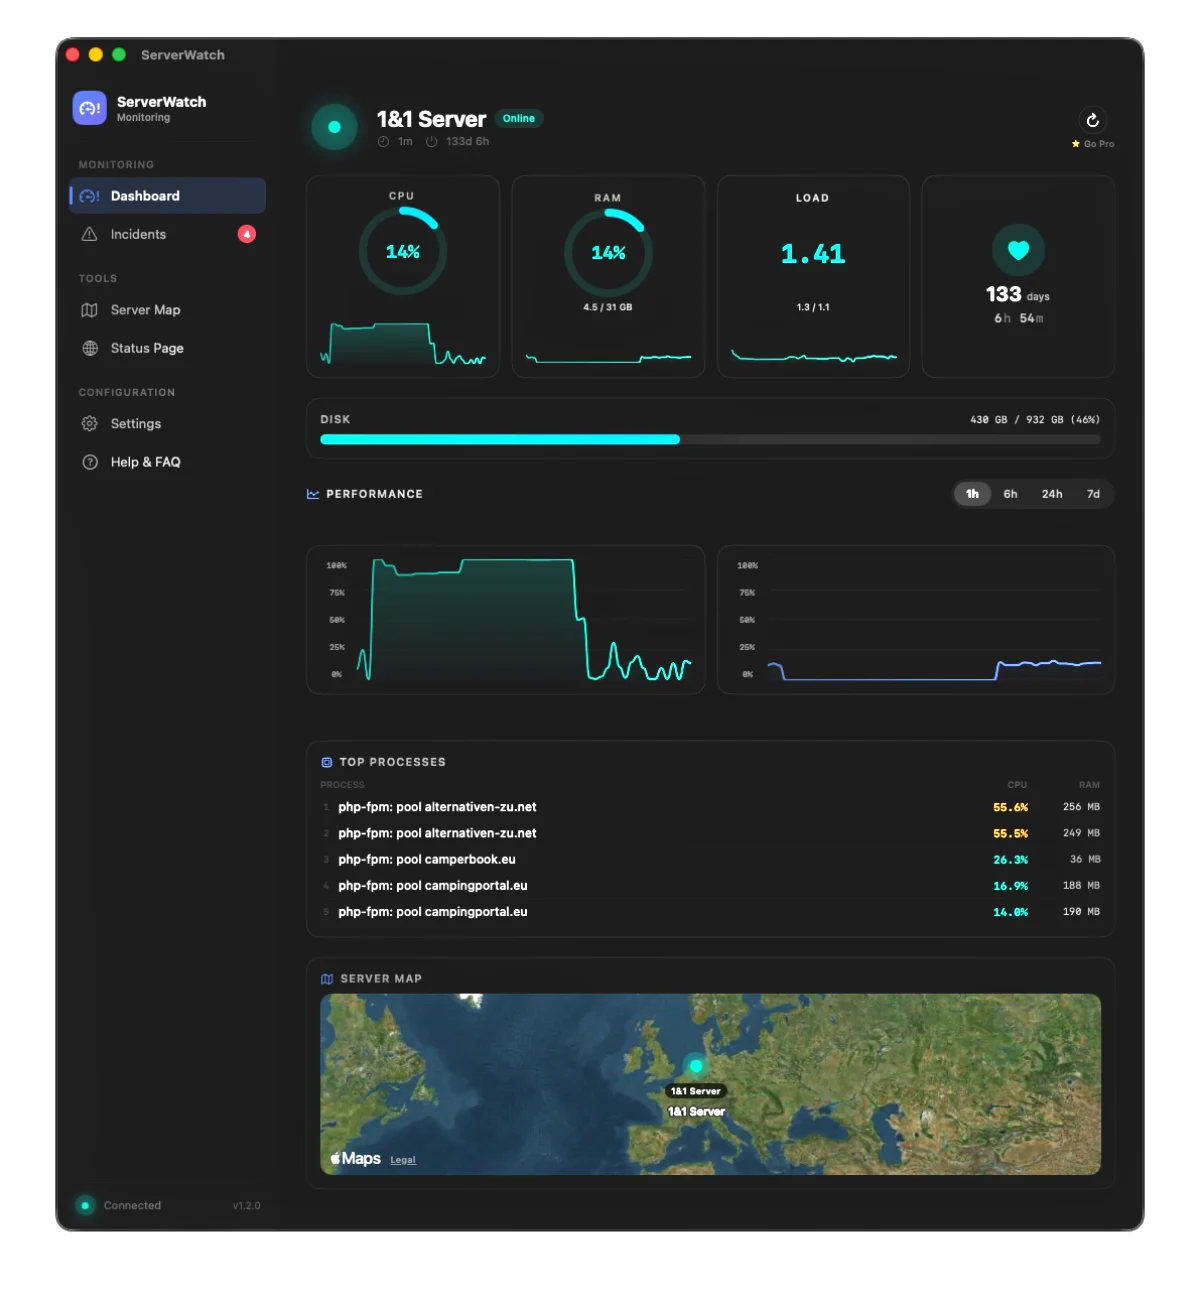
Your Server. Always Monitored.
ServerWatch is a native SwiftUI app for macOS and iOS. The public product page lists the current state as Coming Soon, version v1.2.0. A free version for one server is planned; it is not a stripped-down demo. It supports macOS 14+ and iOS 17+.
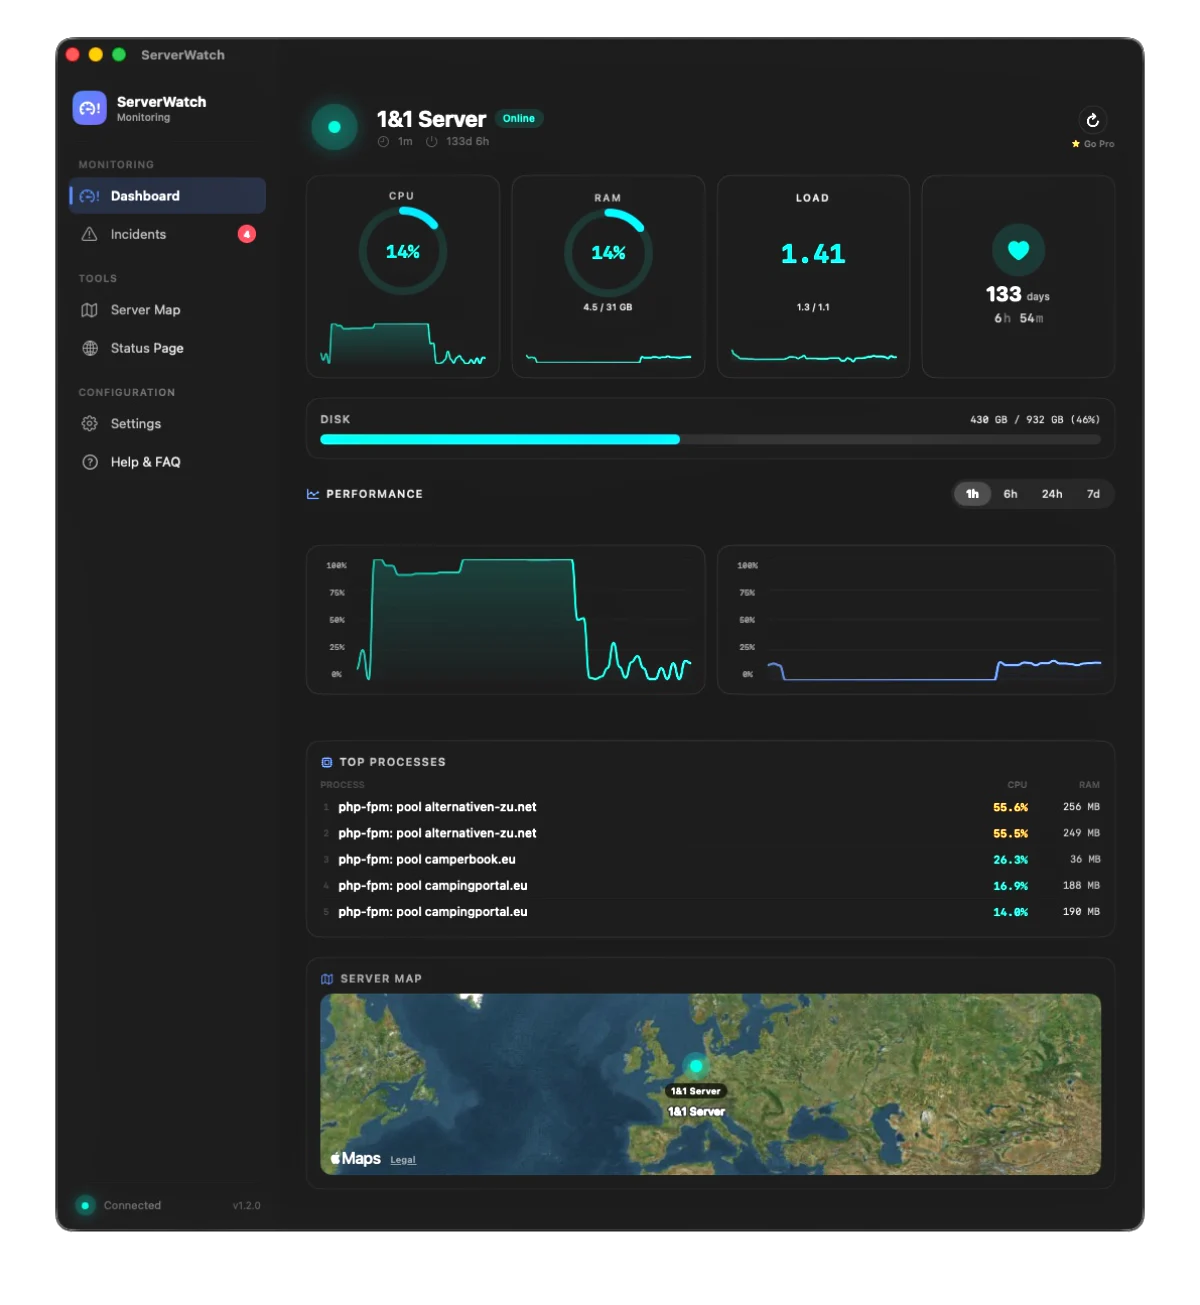
Everything you need
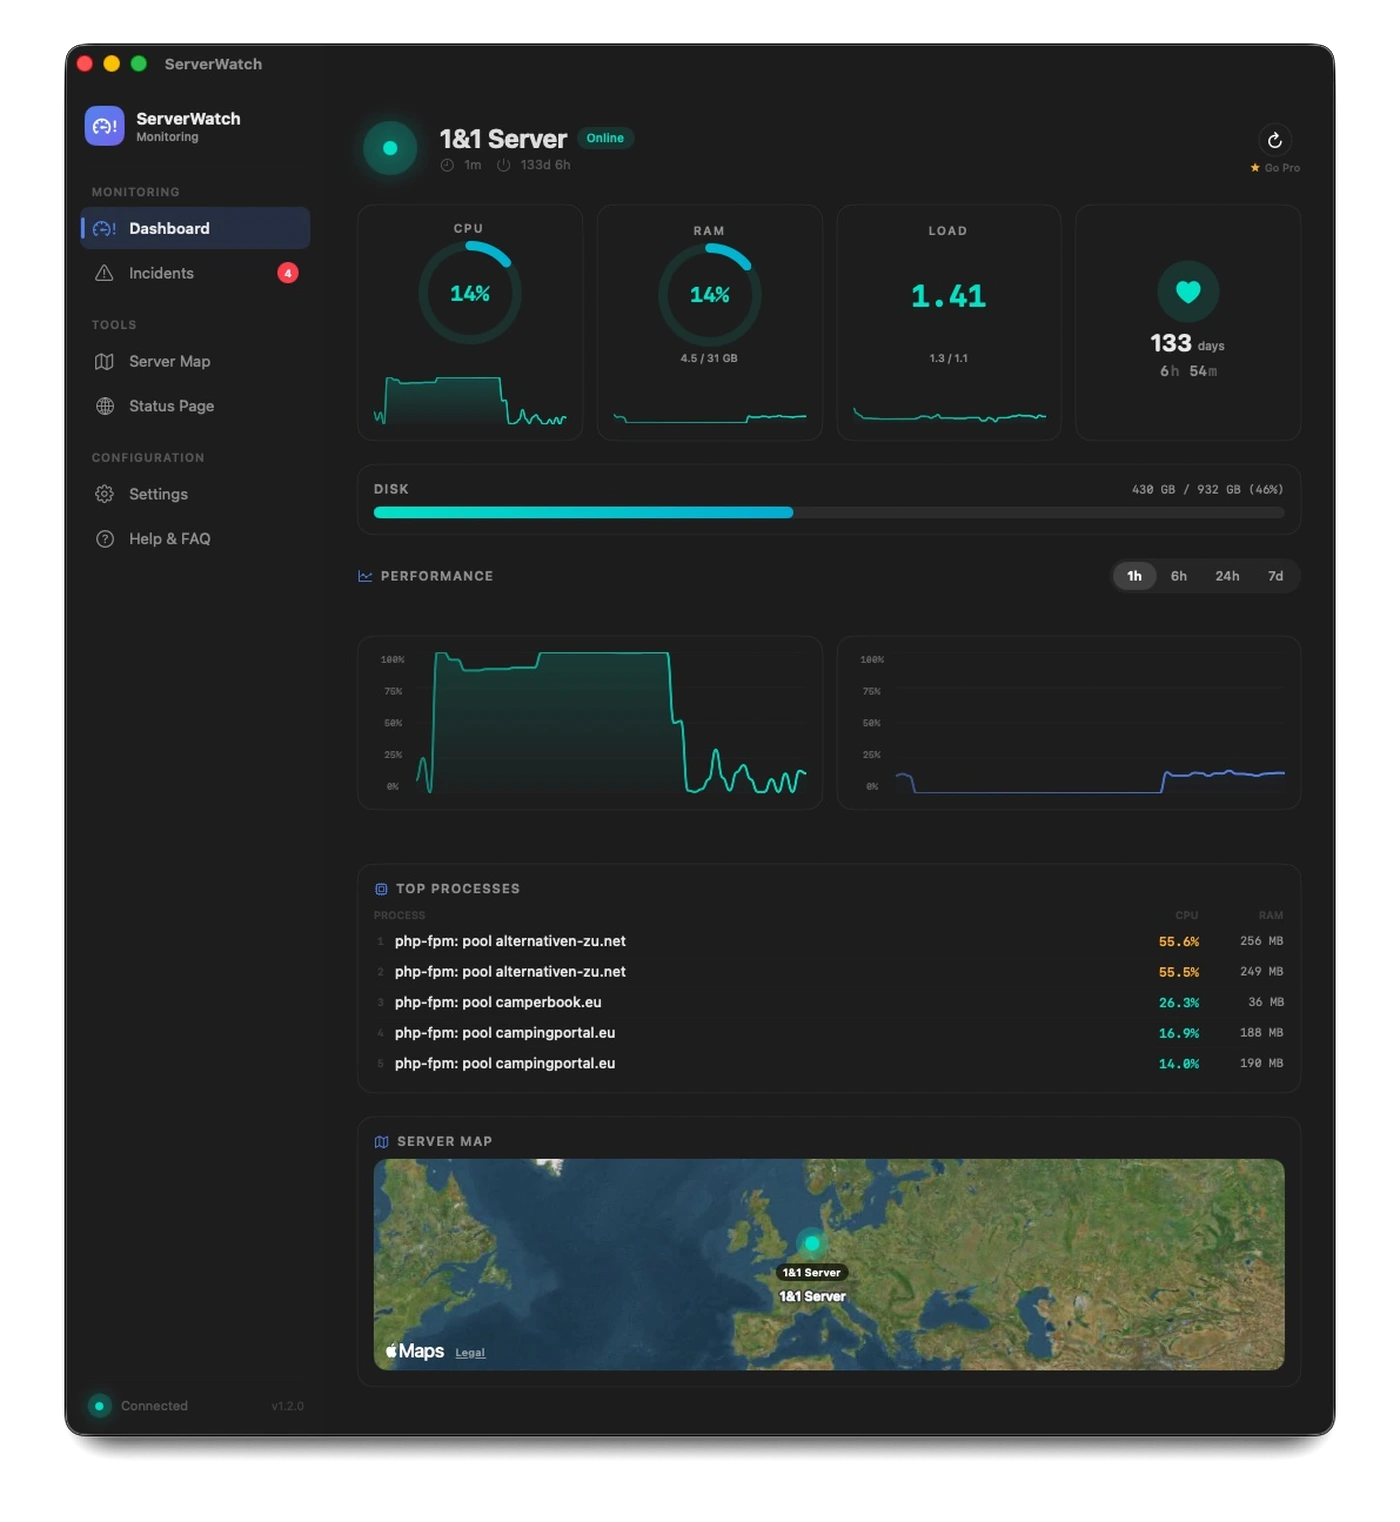
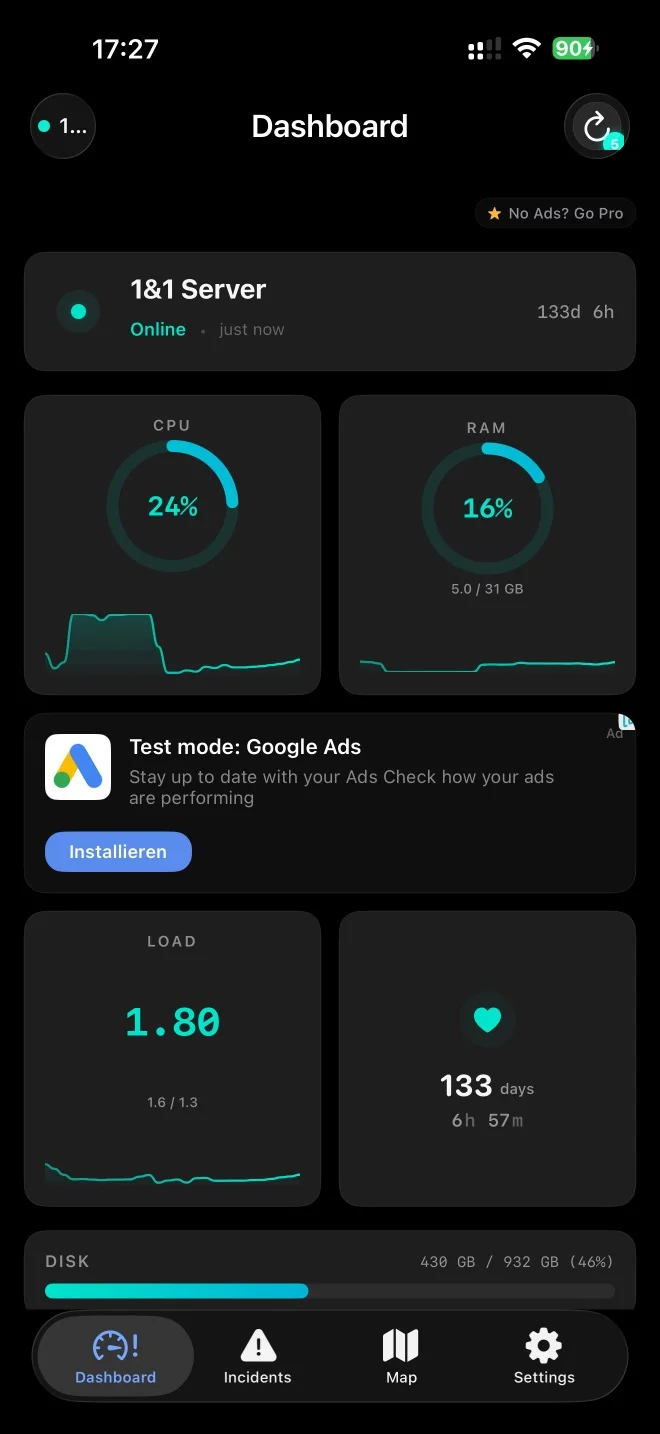
- Real-Time Dashboard: CPU, RAM, load, uptime and disk at a glance, with ring gauges and mini sparklines.
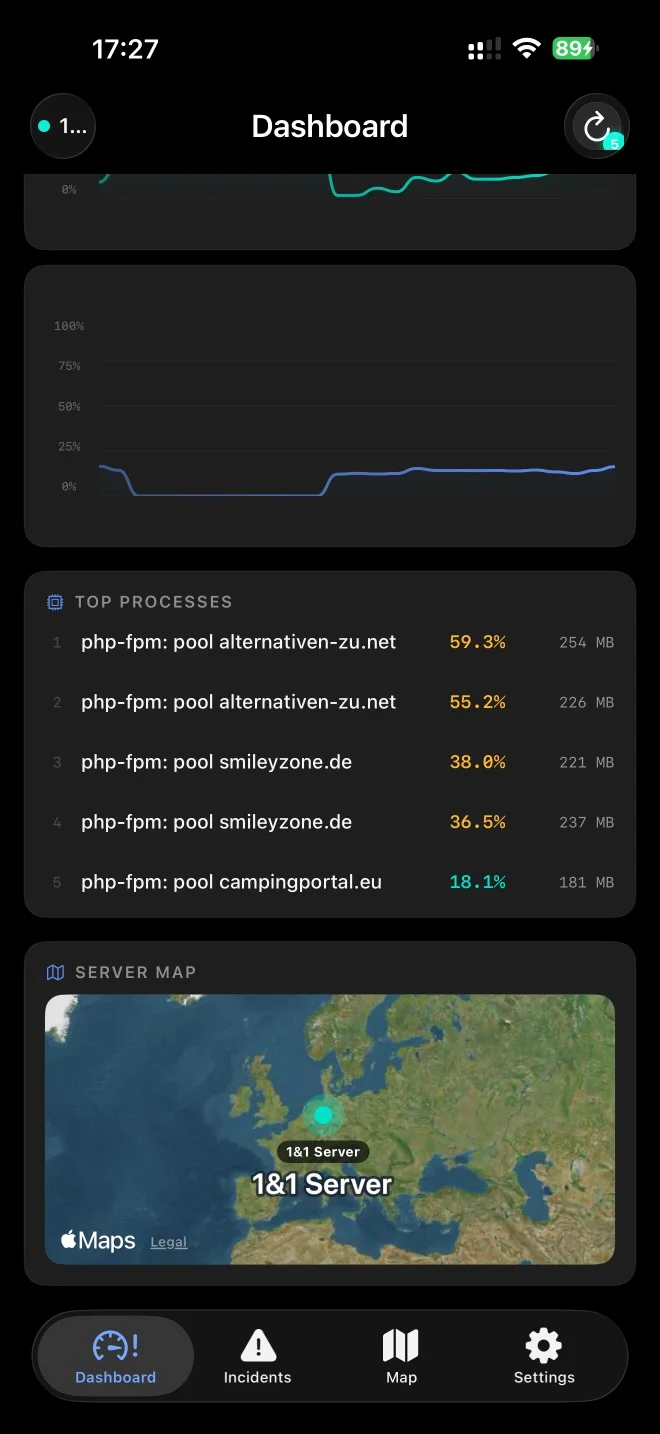
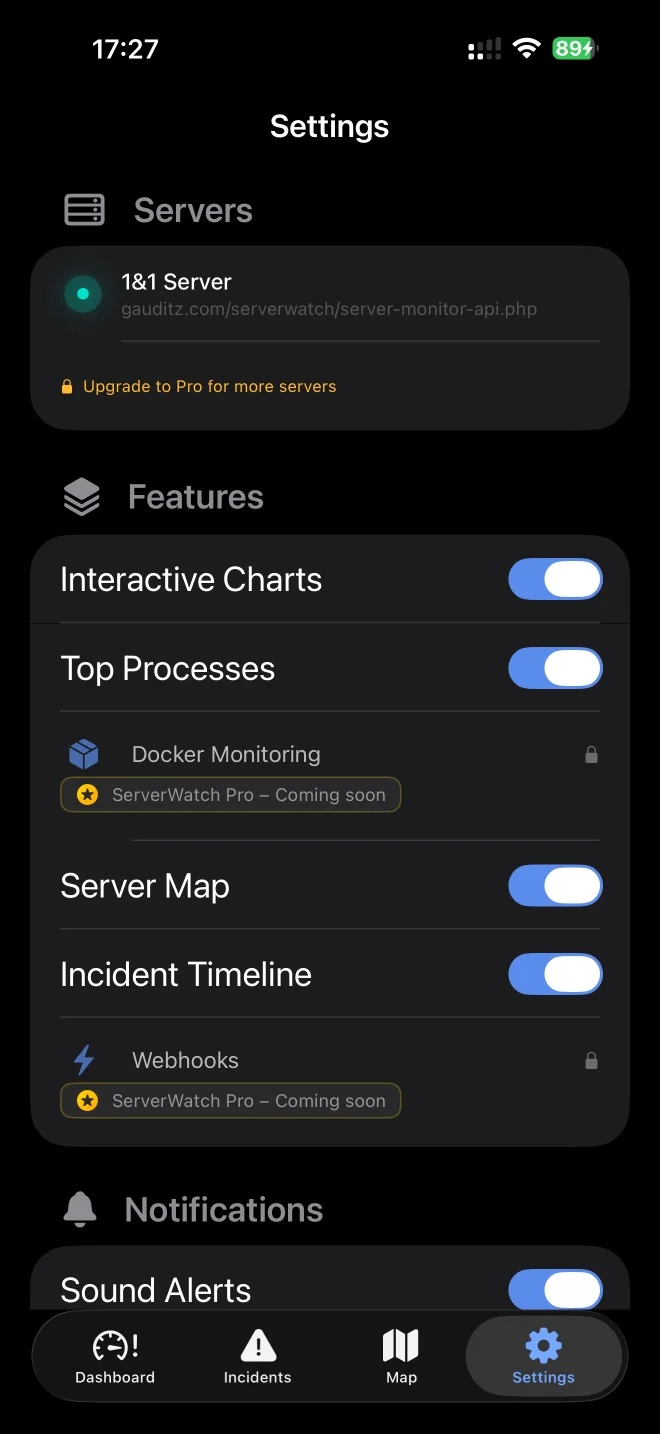
- Interactive Charts: CPU and RAM history over hours and days, with hover details and time-range selection.
- Top Processes: The five processes with the highest CPU and RAM usage, updated in real time.
- Menu Bar Integration: Status dot, sparkline and metrics right in the macOS menu bar.
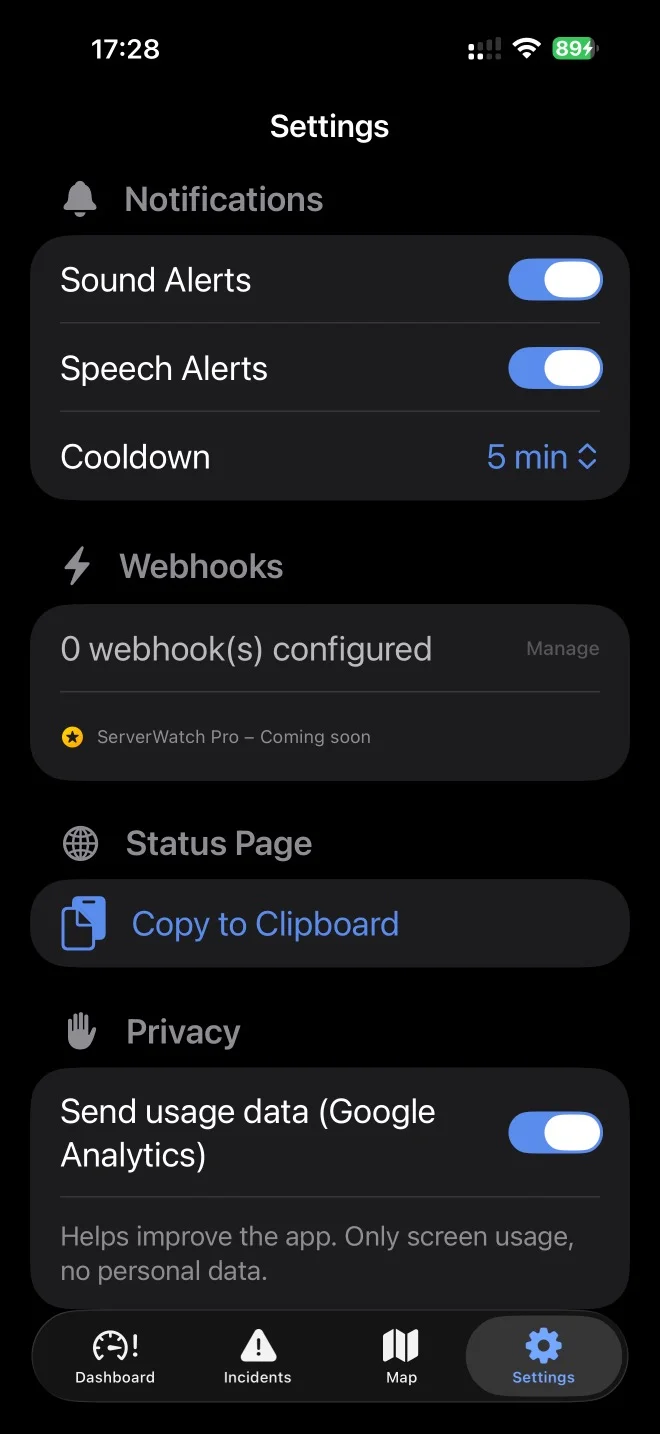
- Smart Alerts: Push notifications, sound alerts and speech announcements when thresholds are exceeded.
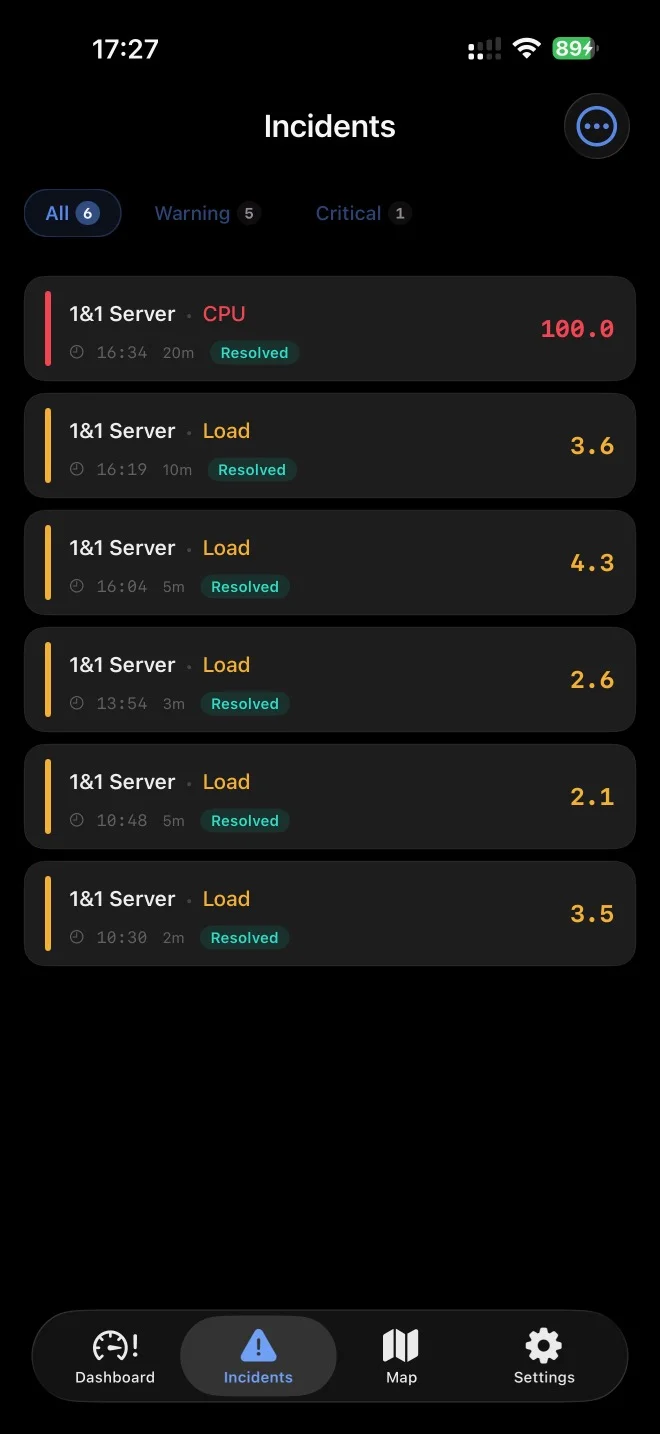
- Incident Timeline: Automatic incident detection and documentation, with filtering and auto-resolve.
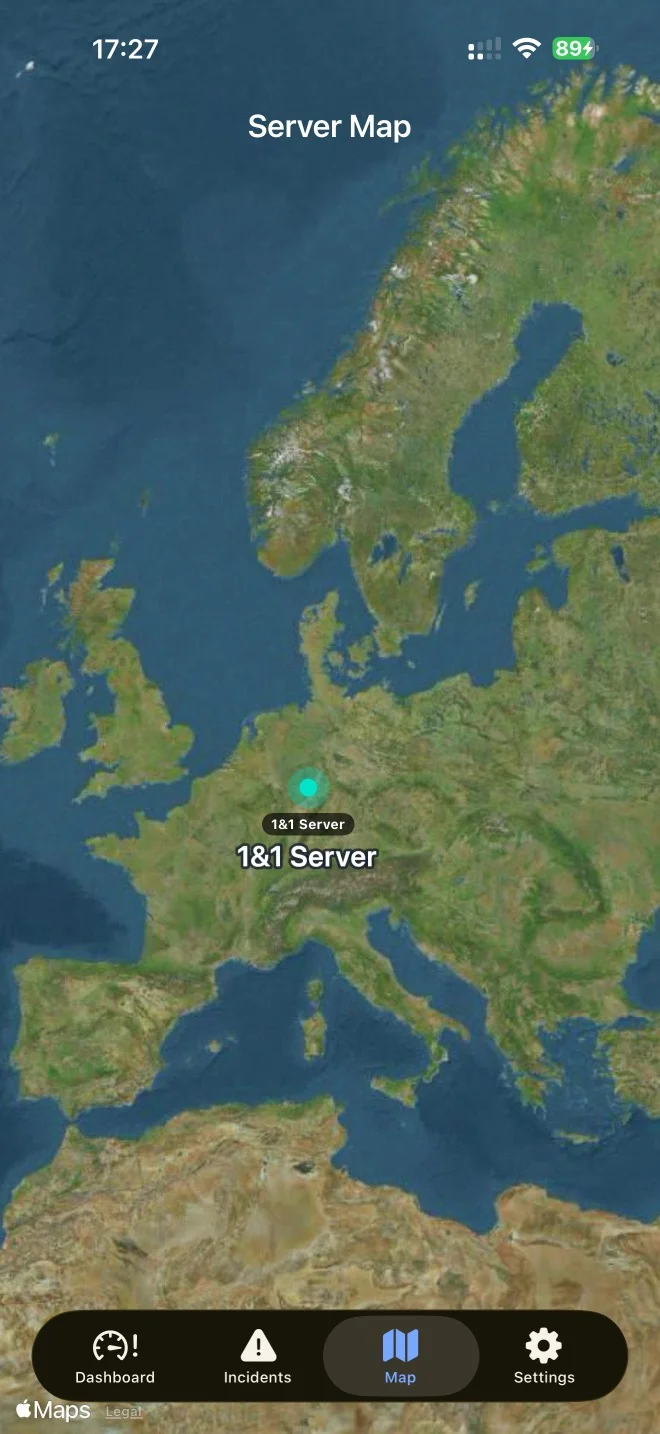
- Server World Map: An interactive MapKit map with colour-coded pins and more than 80 preset locations.
- Status Page: Generate a customer status page and export it as HTML with one click.
- Widgets: Automatically updated desktop, home-screen and lock-screen widgets for macOS and iOS.
- Siri & Shortcuts: Ask Siri for server status or automate workflows with Shortcuts.
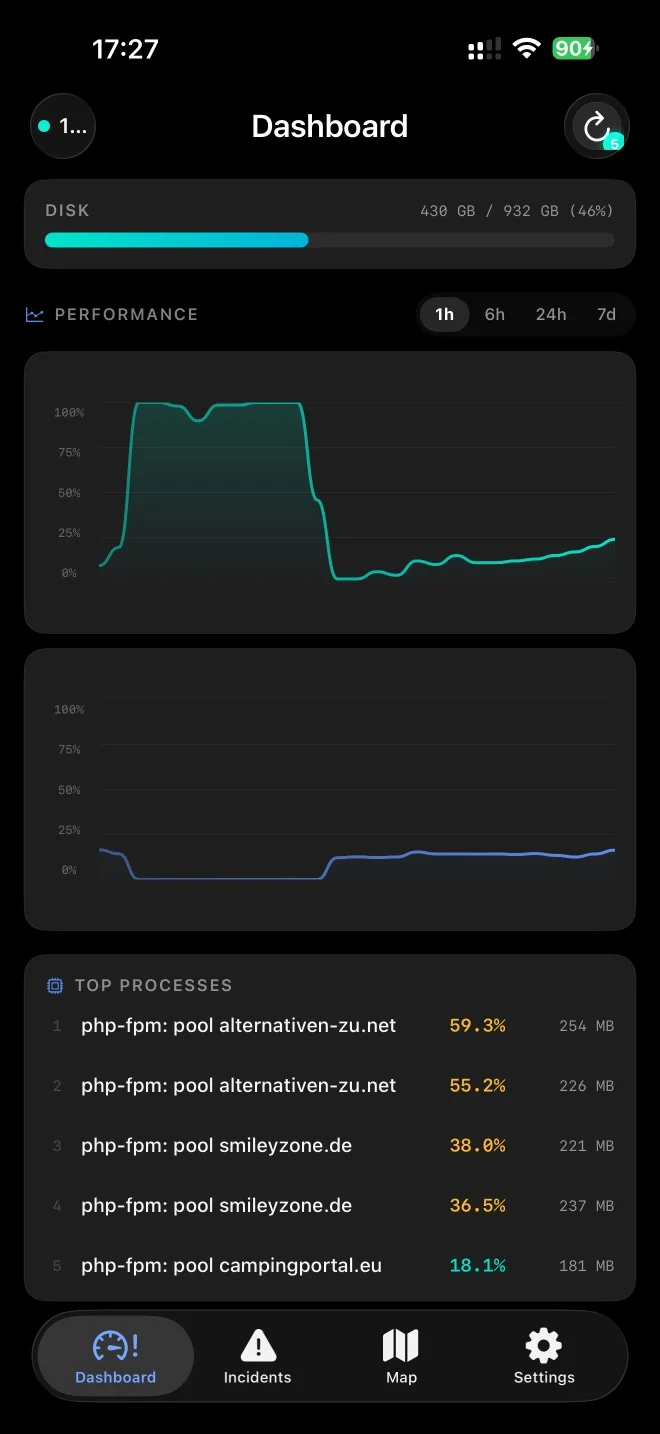
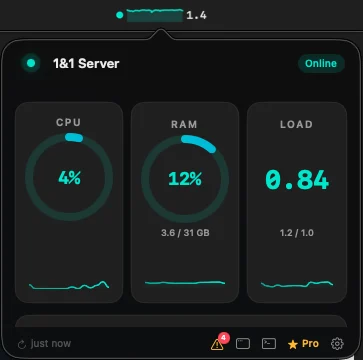
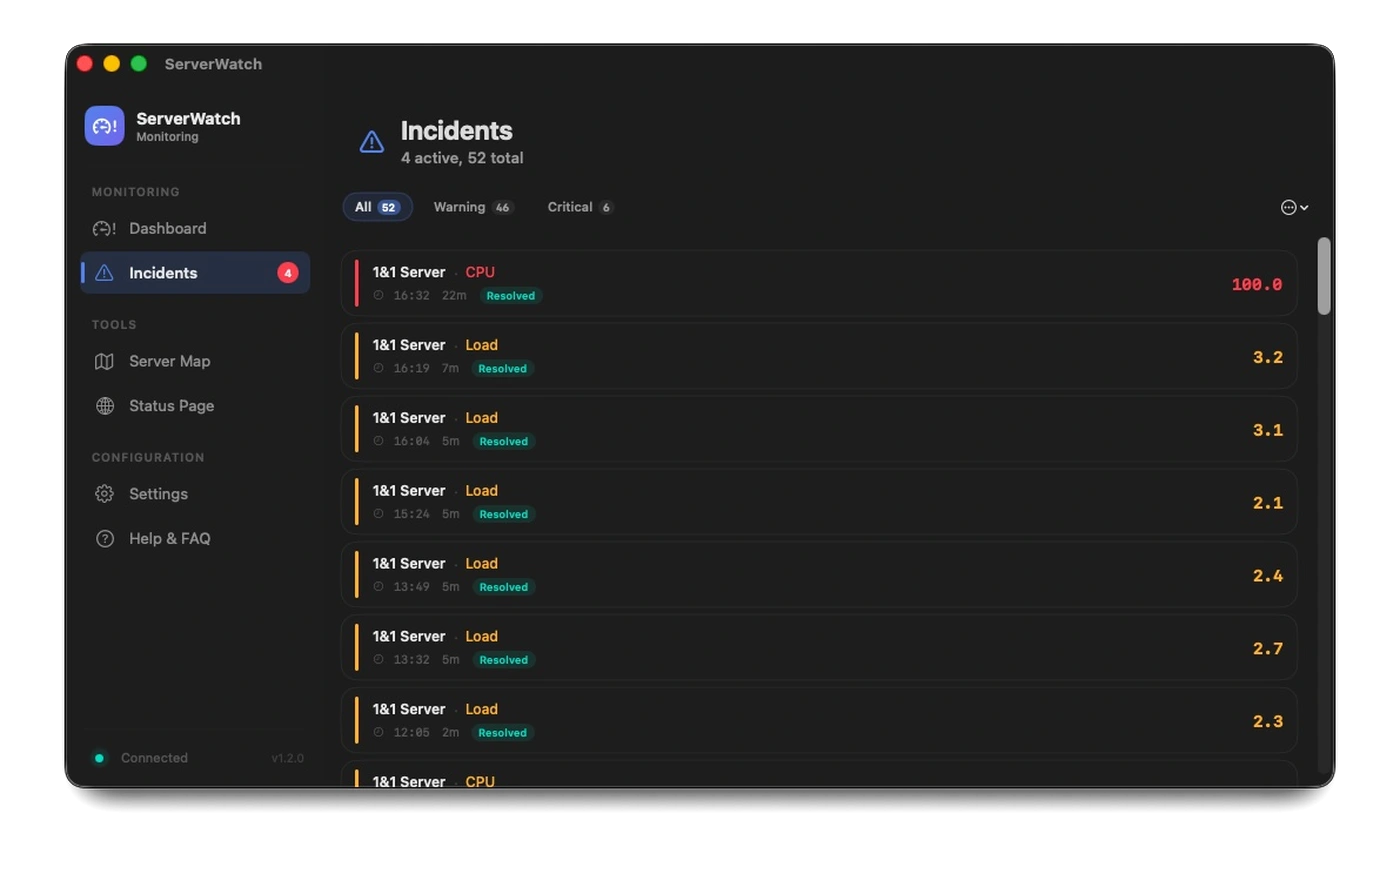
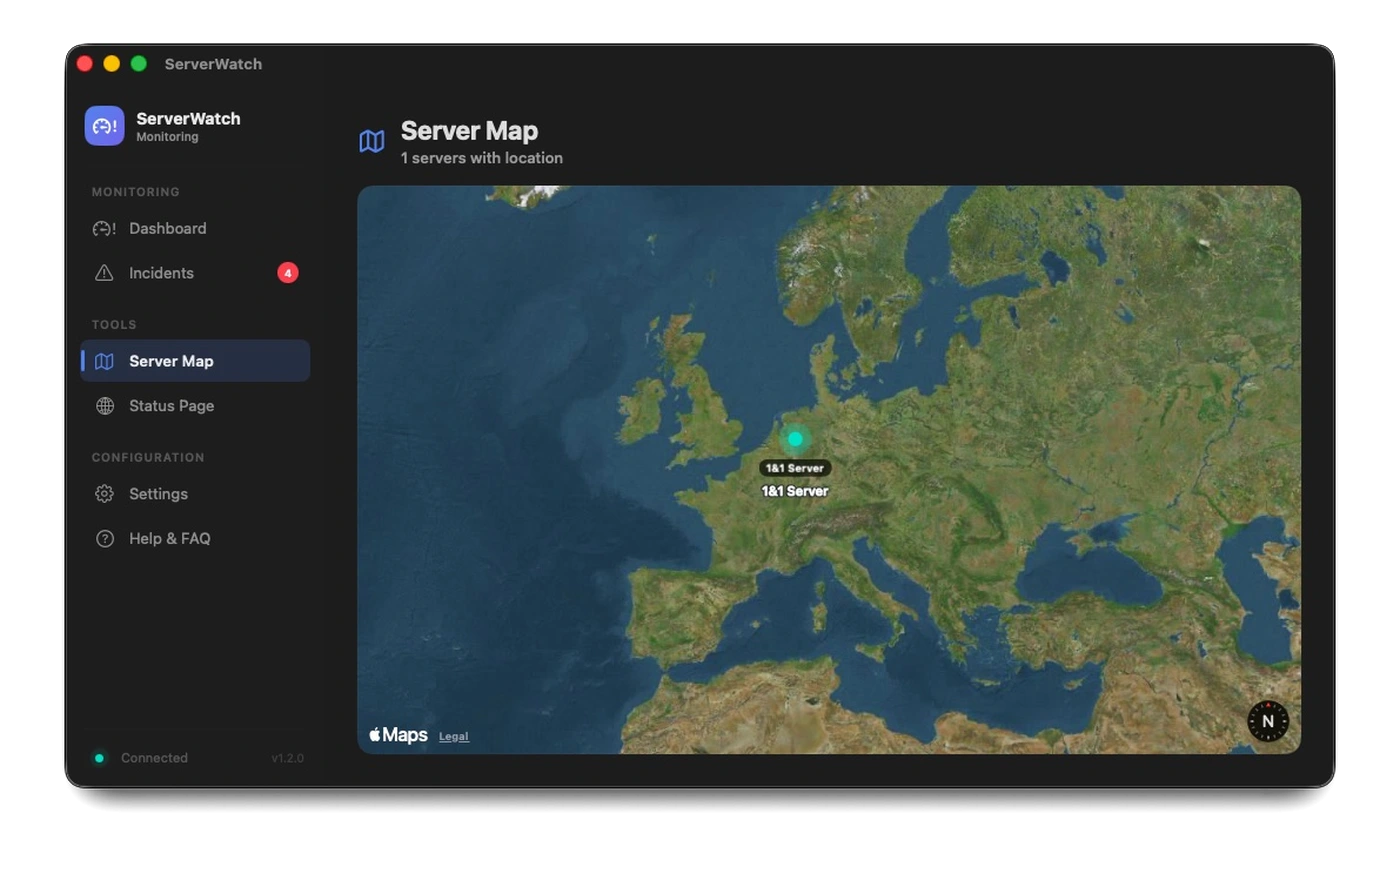
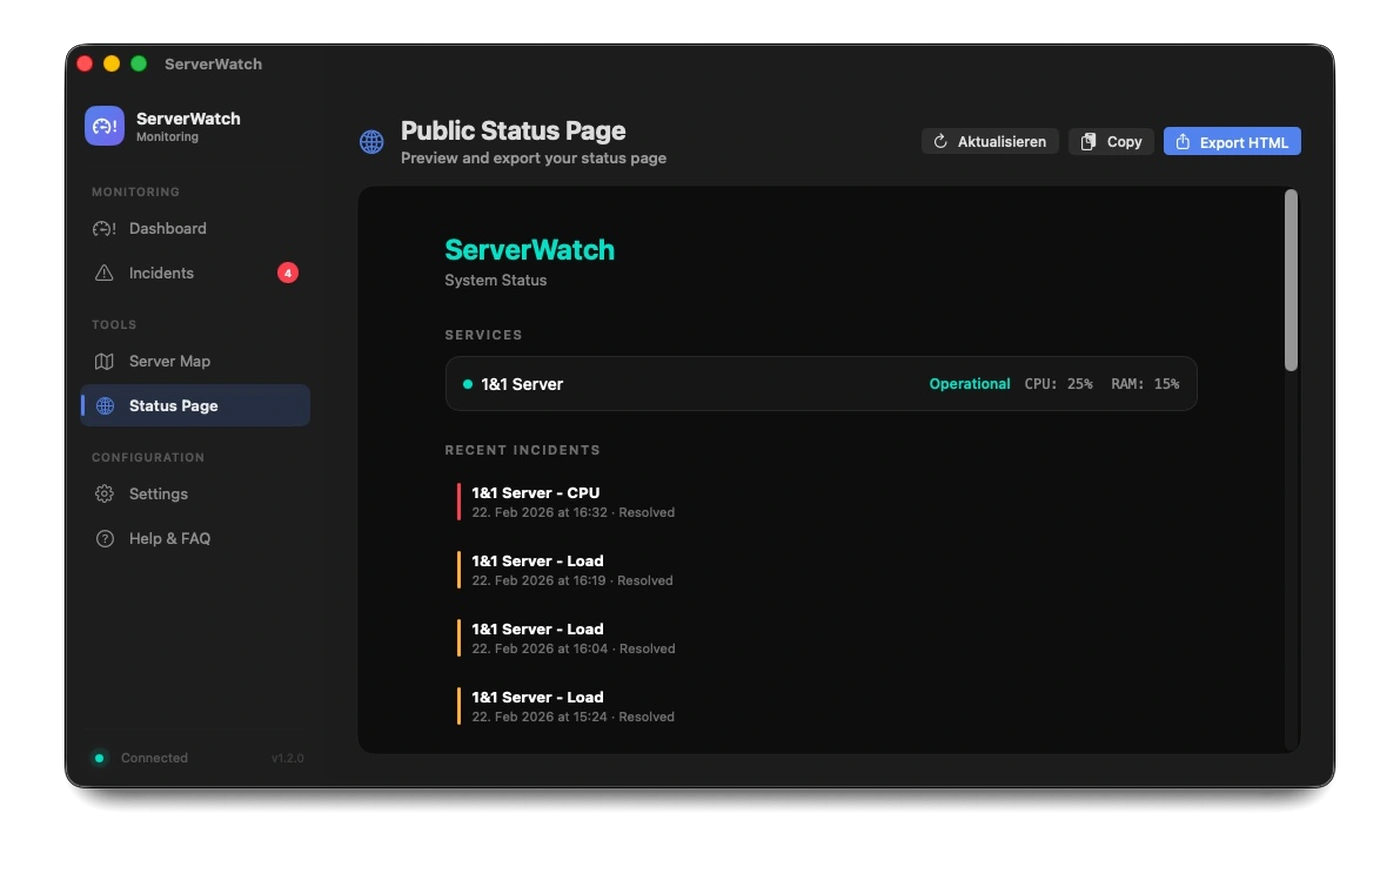
One App. Two Platforms.
The app is built with one shared SwiftUI codebase for macOS and iOS.
Ready in 3 minutes
No agent, no daemon, no root: one PHP file is enough.
- Upload the PHP file: Upload
server-monitor-api.phpto the web server. - Set the API key: Open the file and enter a personal API key.
- Configure the app: Enter the server URL and API key in ServerWatch.
- Done: The dashboard automatically loads the first metrics.
The script reads metrics directly from /proc/; no additional database is required.
Free vs. Pro
The free version is planned for one server. The product page marks Pro as Coming Soon.
| Feature | Free | Pro (Coming Soon) |
|---|---|---|
| Number of servers | 1 server | Unlimited |
| Polling interval | from 5 min. | from 5 sec. |
| Dashboard & metrics | ✓ | ✓ |
| Interactive charts | ✓ | Extended |
| Top processes, menu bar, push notifications, sound & speech alerts | ✓ | ✓ |
| Incident Timeline | ✓ | ✓ + export |
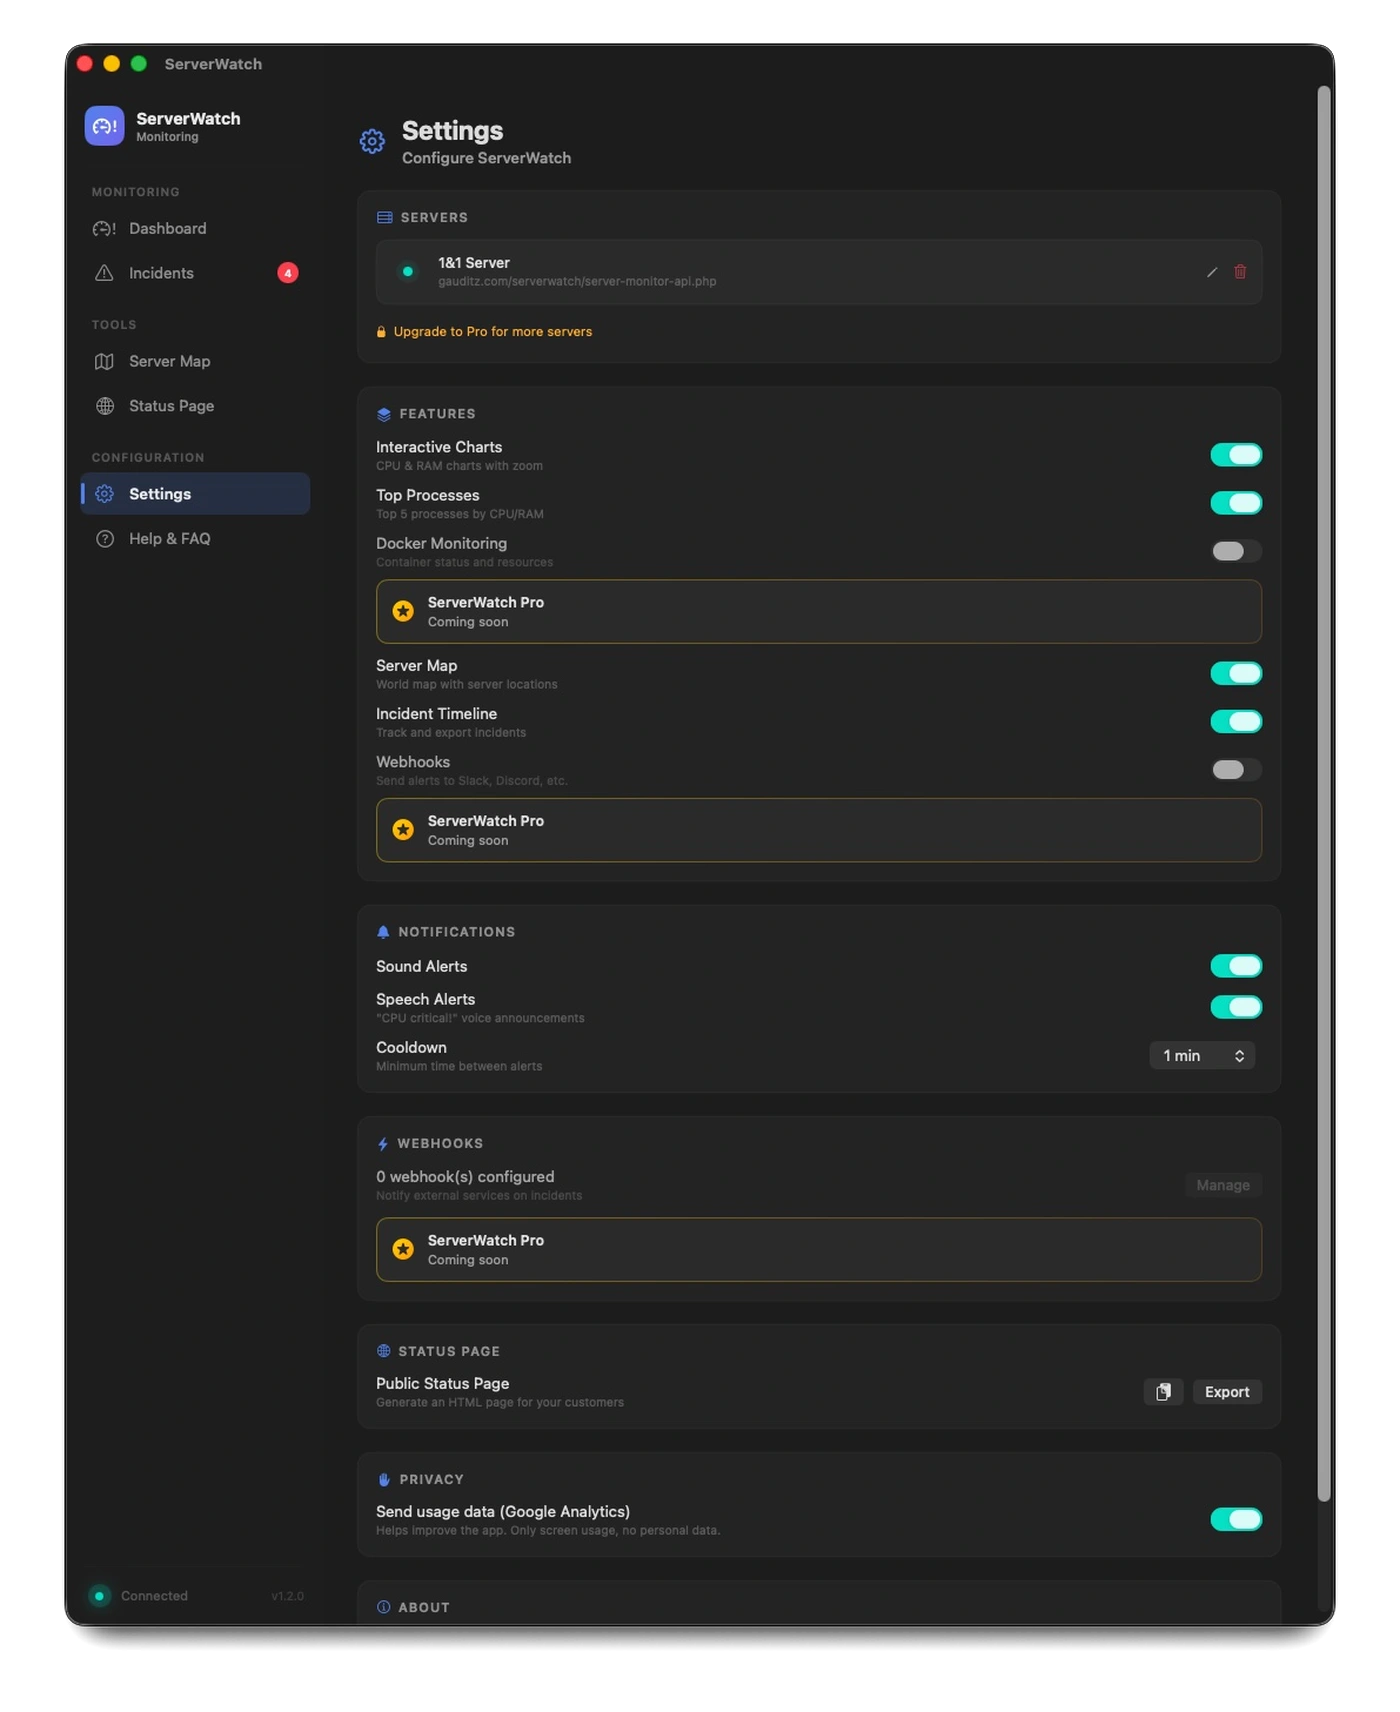
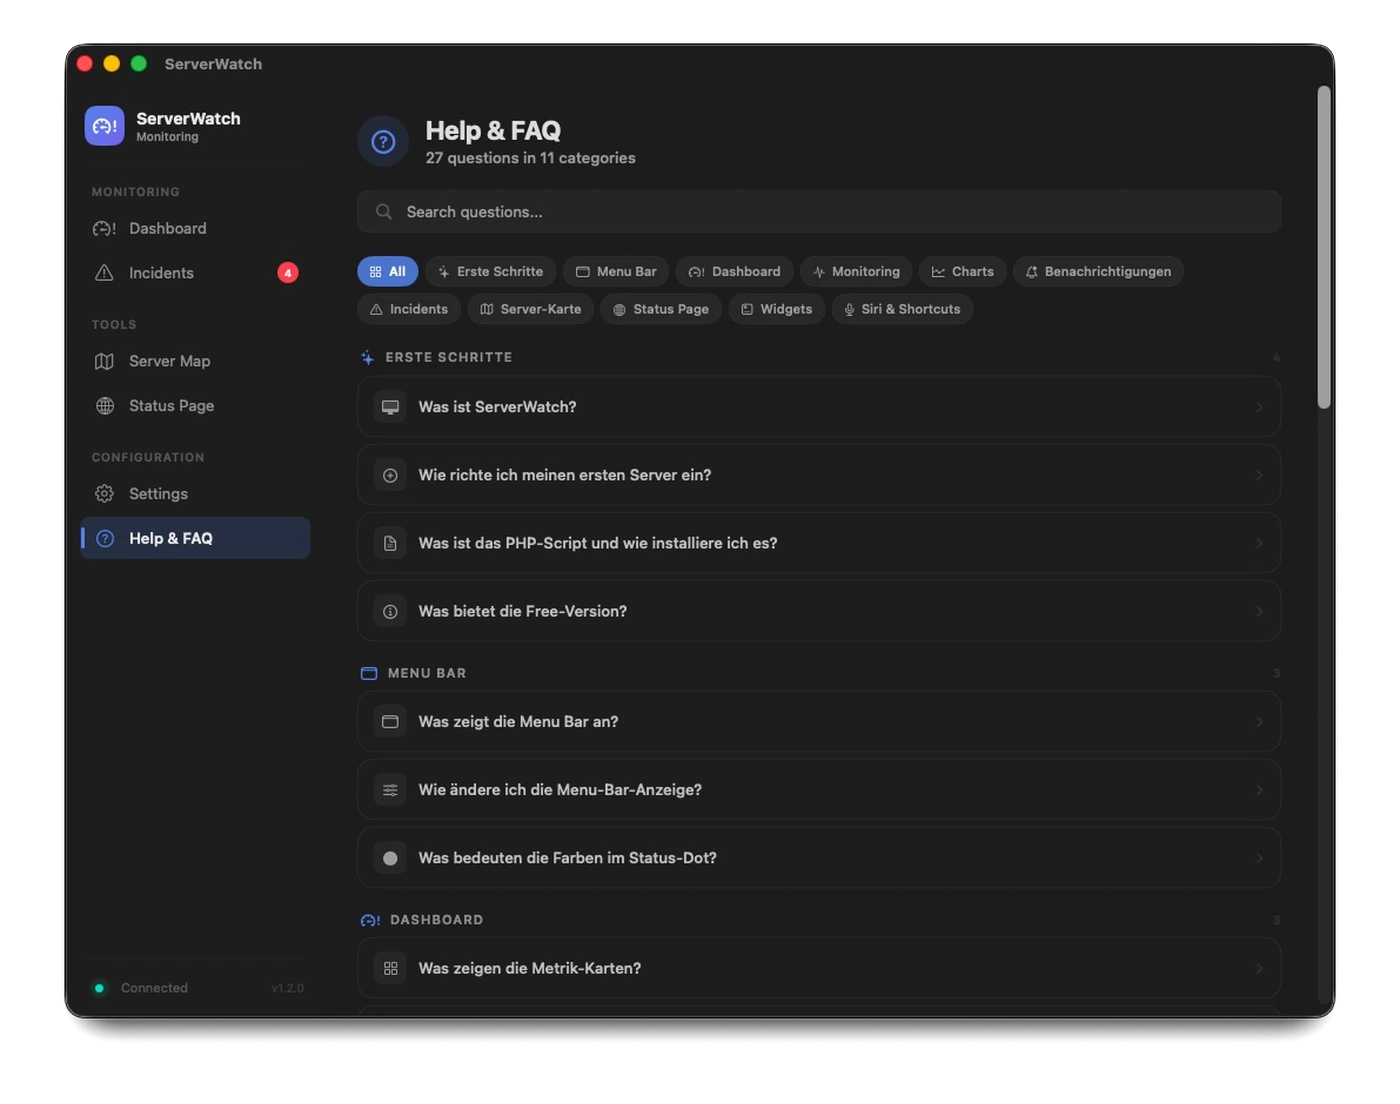
| World map, Status Page, widgets, Siri & Shortcuts, SSH Quick Connect, FAQ & Help | ✓ | ✓ |
| Docker monitoring, Smart Trend Alerts, webhooks | — | ✓ |
| Ads | Yes (iOS) | None |
The technology behind it
- Native SwiftUI app: no Electron app and no web view.
- Multiplatform: one codebase for macOS 14+ and iOS 17+.
- Keychain storage: API keys stay in the system Keychain rather than plain text.
- Lightweight PHP script: one file on the server, with no database.
- No root permissions: metrics are read from
/proc/; no agent is required. - Offline capable: the most recent metrics remain stored locally in SQLite.
More views
Questions about the project? Get in touch.